
Food system overhaul brings $10tn pa benefits; Spanish electricity ducks; tracking concrete tech developments
Radical food system overhaul could deliver US$10 trillon per year in benefits.
A report from the Food System Economics Commission (FSEC) argues that the current set up of food systems globally (i.e. what food we grow, how we grow it and how we distribute it to people) has a cost far bigger than their contribution to global prosperity and is on an unsustainable trajectory.
However, whilst a radical overhaul of the global food system to make it more sustainable could raise agricultural commodity prices by approximately one third by 2050, this would be outweighed by US$5 trillion to US$10 trillion per year in benefits - that represents 4% to 8% of global GDP in 2020.
Let's first look at some of the costs of the current food system highlighted in the FSEC report over and above the direct costs of producing and distributing food:
- Health costs: the economic cost of ill health and its negative impacts on labour productivity = US$11 trillion. These come from the impacts of undernutrition (estimated as currently impacting 735 million people globally) but largely from non-communicable diseases such as diabetes, hypertension and cancer with a large share of the burden born by people living with obesity (estimated at 770 million people globally). The focus on 'yields per unit input' has led to a massive growth in agricultural produce supply and subsequent declines in price. But that availability of increasingly cheaper calories has led to a vicious circle of increasing demand for cheaper production, increasing waste and higher levels of obesity.
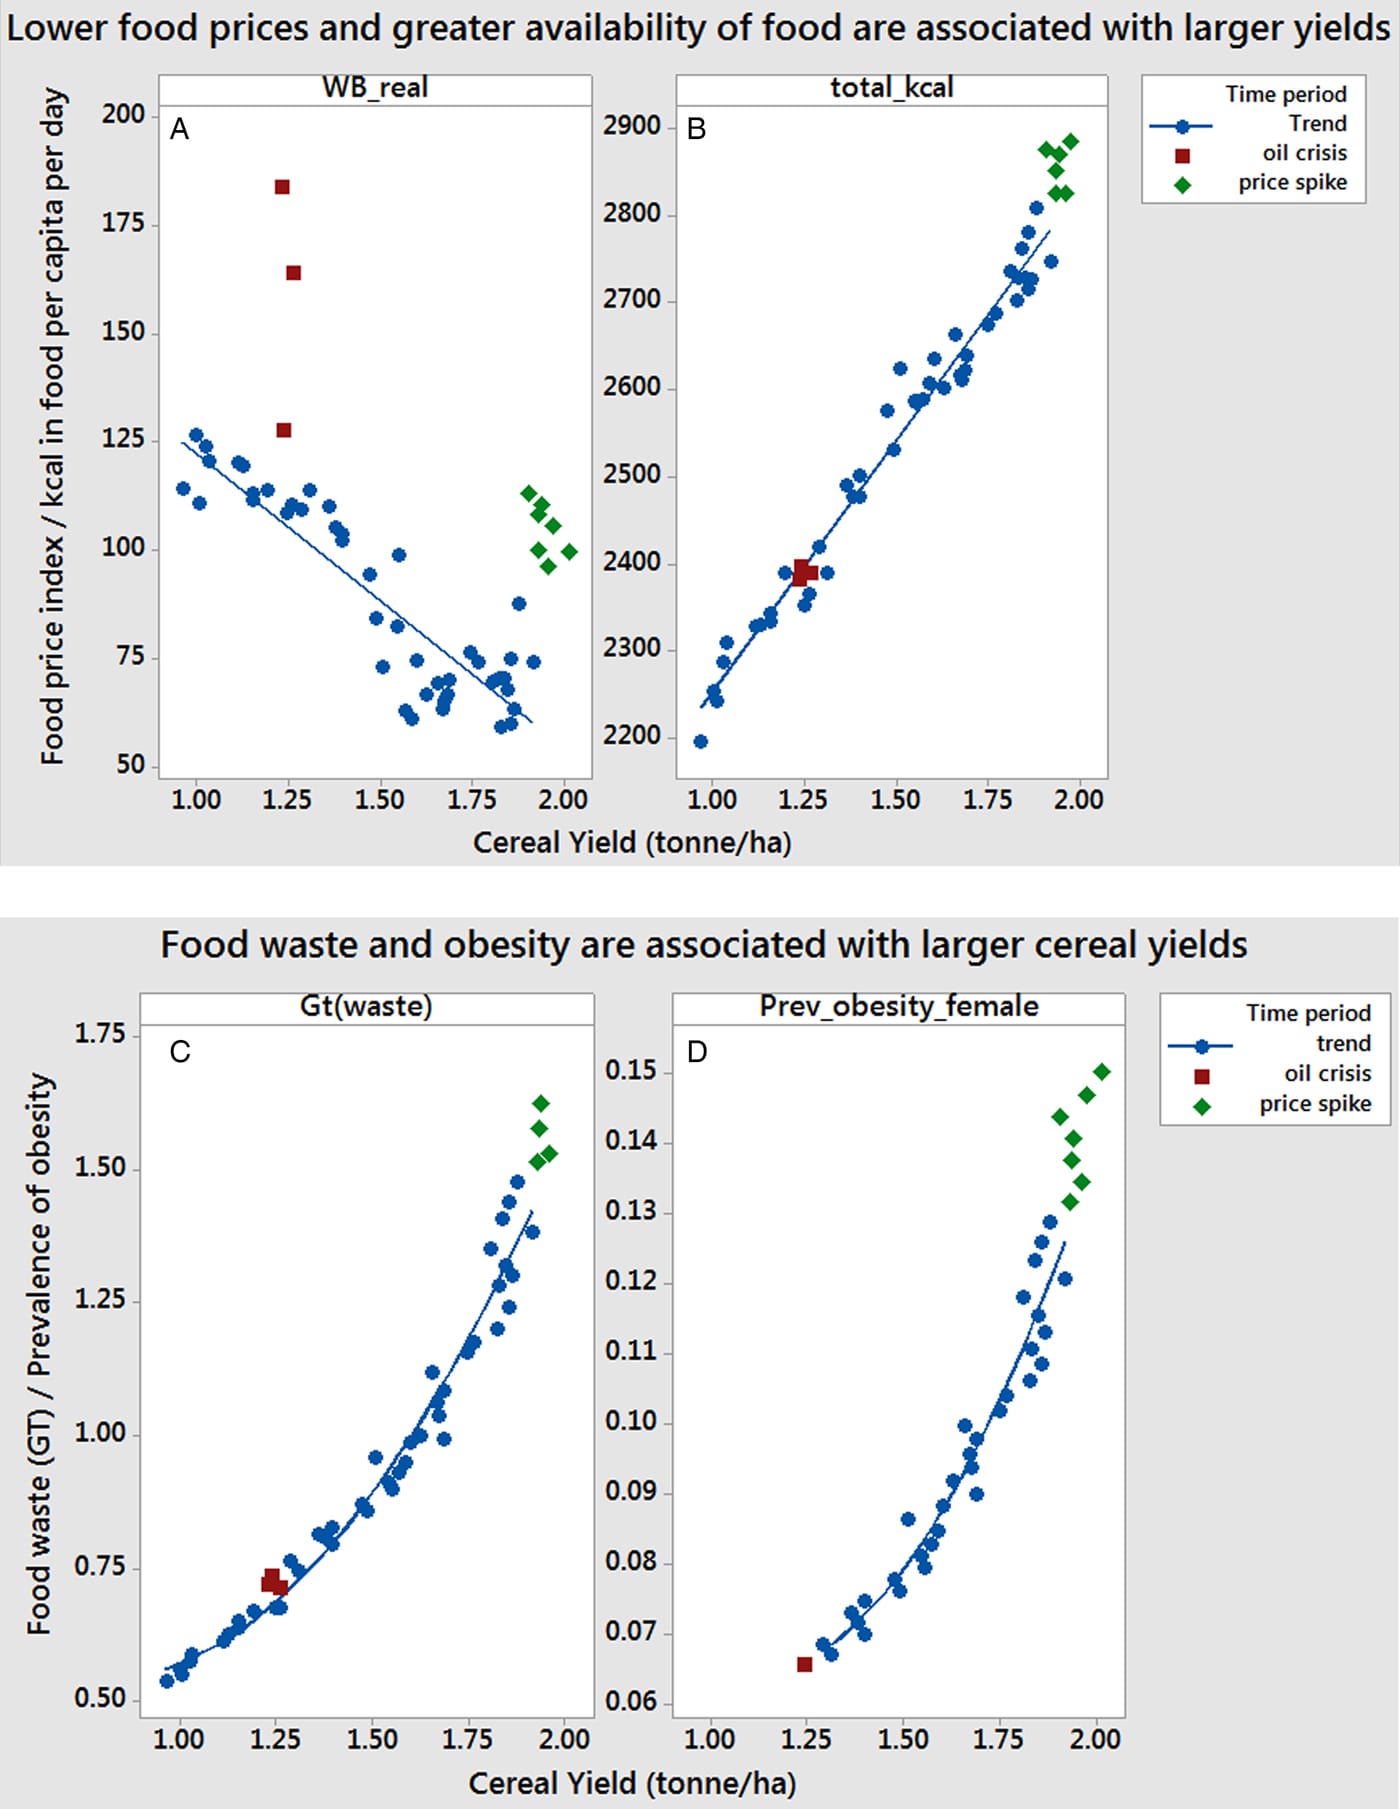
Under the current trends pathway, by 2030, the direct medical costs of treating the health consequences of overweight and obesity could rise from US$600 billion today to close to US$3 trillion by 2030.
- Environmental costs: reflect the negative impacts on ecosystems and climate = US$3 trillion. Current practices account for one third of global greenhouse gas emissions, net loss of more than 6 million hectares of natural forest per year and biodiversity loss and impacts from nitrogen surplus, leaching into water and air. Under the current pathway scenario it is estimated that food waste increases by 16% to 76 kg of dry matter per capita in 2050 - that's almost one of Sandy per person per year in food waste! Between 2020 and 2050, an area equivalent to 1.3x the size of France will be lost in natural forest and the nitrogen surplus increases by 22% to 300 Mt N per year, further polluting and destroying biodiversity.
- Structural poverty: reflects the low incomes of many who work in food production.
So what are the changes being proposed in the 'Food System Transformation' pathway?
- Shifting consumption patterns towards healthy diets through policy/marketing regulation etc.
- Resetting incentives and repurposing government support for agriculture addressing the balance between 'Big Agriculture' and smaller independent farmers - the recent farmers' protests in France show that this is a global issue. Subsidy repurposing needs careful thought so as not to displace production to less efficient countries, increasing environmental adverse impacts.
- Resetting incentives and targeting revenue from new taxes to support the food system transformation, making food systems net carbon sinks and reducing nitrogen pollution.
- Innovating to increase labour productivity and workers' livelihood opportunities, especially for poorer workers in food systems. For example, improving plant breeding in low- and middle-income countries; supporting environmentally sustainable, biodiversity-friendly, and low-emission farming systems.
- Scaling up safety nets to keep food affordable for the poorest, with an initial focus on children.
Implementing these changes is estimated to cost between US$200 billion and US$500 billion per year but the expected benefits should amount to US$5 trillion per year at least (and potentially as much as US$10 trillion per year) so dwarfing that cost.
The Food System Economics Commission is an independent academic commission set up to help political and economic decision makers shift land-use and food systems to be more sustainable. It was convened by Gunhild Stordalen (EAT), Jeremy Oppenheim (Food and Land Use Coalition, FOLU) and Johan Rockström (Potsdam Institute for Climate Impact Research, PIK) who pioneered work on the planetary boundaries framework. A short introduction to them is in the video below 👇🏾
There have been some innovative solutions proposed in the past ranging from diverting crops currently used to feed livestock to humans and a complete shift in how we view productivity. Here is a Deep Dive we published back in September 2022 that covers two research papers not covered by the FSEC report.
Link to blog 👇🏾
 Sandy Jayaraj
Electricity Ducks being seen in Spain
Solar electricity generation offers the potential for low electricity prices, at least when the sun is shining. Data shows that there is a decent correlation between the market price of electricity and what is called the residual load (demand minus supply contributions from wind and solar). The best way to illustrate this is the now 'famous' duck curve, so called because it looks (a bit) like a duck.
The chart was first publicised in California, with a deeper and deeper duck belly (lower residual load = more solar) showing up between 2012 and now.
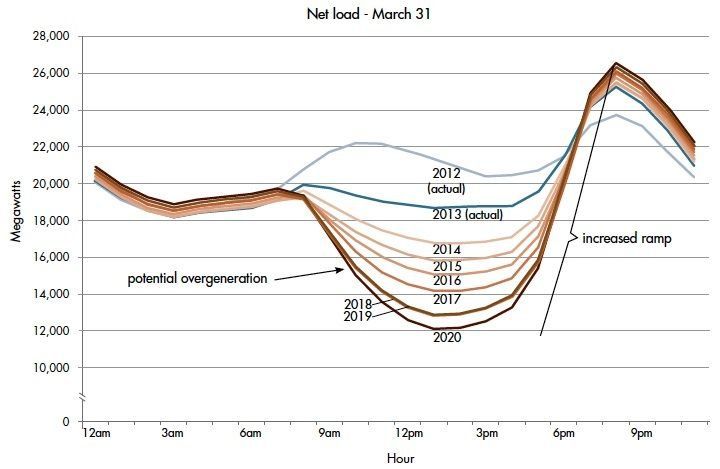
We wrote about this back in June 2023 (link below). But this does not just happen in California. A couple of weeks ago, GEM Energy Analytics wrote a really interesting blog on what is happening in Europe.

Across Europe, solar power is showing a surge in growth. According to SolarPower Europe "in absolute terms new additions between 2024 and 2027 will contribute 313 GW. This will take total installed Solar PV capacity to 576 GW by the end of 2027, an increase of 119%".
To give this some scale, between April and October, when solar will be producing at its peak, the average load (demand) ranges between 270 and 300 GW. One obvious potential consequence of this high level of supply could be that solar becomes the price setter for material parts of the year.
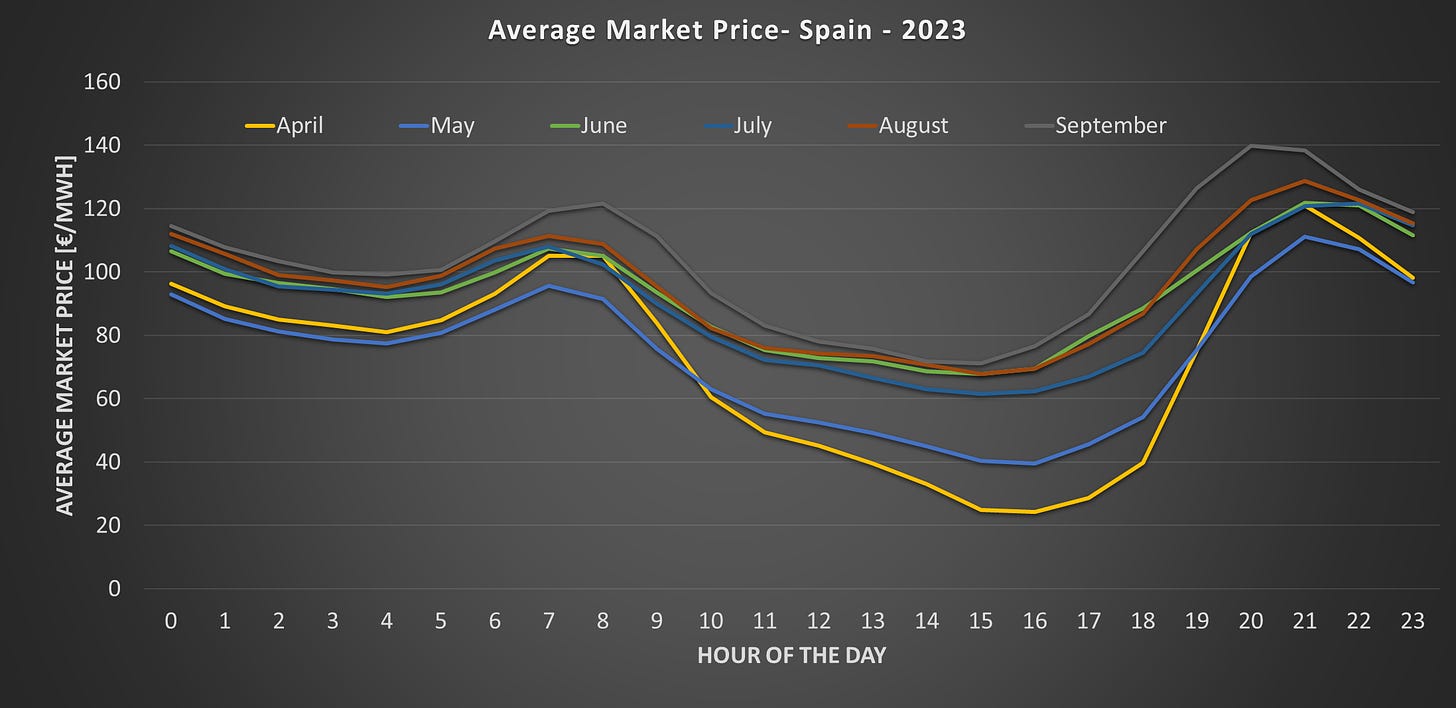
What is this doing to electricity average prices - taking Spain as an example? A picture says a thousand words ....
One possible consequence of this trend is that the economics of new solar get weakened, at least for what is known as merchant power. The SolarPower Europe report we quoted earlier suggests that this might slow down supply growth. Their forecast for new supply being built in Spain is now "26% less than the June 2023 expectations".
Looking forward this suggests a growing importance for battery storage (to time shift supply into the evening peak), and a material need for demand management (moving the peak by shifting demand out of the existing peak periods).
As we said above, we wrote on the Duck curve, and why all sustainability professionals and investors need to care about ducks, in a blog we published in June last year. Our point, just to reinforce it, is that while solar will probably be our renewable electricity generator of choice in the future, its growing market share means we need to think about all of the other aspects of our electricity grids now - before the challenges become real.
Link to blog 👇🏾
Steven Bowen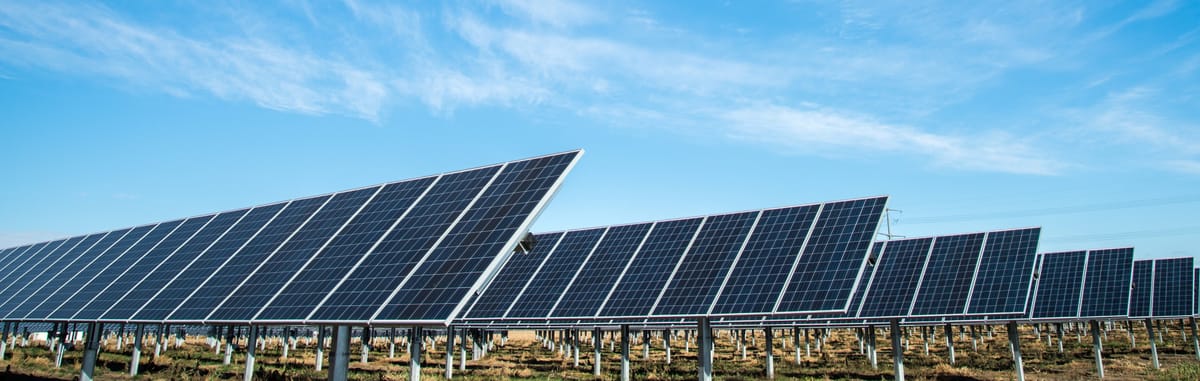
Tracking concrete technology developments
Among the various organisations interested in lower carbon concrete is, unsurprisingly, the Institution of Structural Engineers. Concrete is a massively important building material. But, as they say "publicly available information about these technologies is often limited and inconsistent, making it difficult to draw comparisons with conventional concrete."
Which is why they have a dedicated webpage focused on providing the information that professional engineers need to understand how the various 'new' technologies match up against conventional (Portland Cement) concrete.
Behind drinking water, concrete is the most used man-made material on earth, with 14 billion m3 produced each year. As a result, the production of cement, the active binding agent in concrete, accounts for around 7% of global CO2 emissions. While concrete production emissions arise from a range of sources, cement production is responsible for almost 60% of the embodied carbon in reinforced concrete. Thus, with 2050 rapidly approaching, action must be taken to reduce emissions and realise net-zero commitments. To address this, many companies are developing lower carbon concrete technologies.
But, with many company statements being not much more than press releases, how do engineers, sustainability professionals, and investors, evaluate the various claims?
The good news is that the Institution has identified 13 different technology streams under development. All the way from optimising existing concrete production (still high emissions but already commercially viable), through to biocement (potential for low emissions but still in the R&D phase).
It's important to note - so far there is no single technology stream, or “silver bullet”, that is sufficiently scalable to eliminate global concrete production emissions. As the RMI says in its recent report The 3C's of innovation in low carbon concrete , a 1.5 degree aligned transition will likely rely on us using most, if not all of them.
This is not a winner takes all transition.
We wrote about some of the possible low carbon concrete options in a blog back in May 2023. As we said in the blog, not only is concrete production already a major source of CO2 emissions, increasing urbanisation means we are likely to use more concrete in the future, not less. On the positive side, alternative building materials, such as timber, are expected to gain market share. But, again, this solution is unlikely to be a universal panacea. We are still going to need a lot of concrete.
Link to blog 👇🏾
Steven Bowen
Please read: important legal stuff.

